Gráficos SVG - Ficheros - Soluciones (3): Bucles anidados

Se ofrecen a continuación unas posibles soluciones de los ejercicios SVG Ficheros (3).

Gráficos SVG Ficheros (3) - 1

Gráficos SVG Ficheros (3) - 1 - Figura 1

SVG Ficheros (3) 1 1
import webbrowser


def main():
    ruta = "svg-ficheros-3-1-1.html"

    with open(ruta, mode="w", encoding="utf-8") as fichero:
        print("<!DOCTYPE html>", file=fichero)
        print('<html lang="es">', file=fichero)
        print("<head>", file=fichero)
        print('  <meta charset="utf-8">', file=fichero)
        print("  <title>Ficheros (3) 1-1. SVG. Ejercicios. Python</title>", file=fichero)
        print('  <meta name="viewport" content="width=device-width, initial-scale=1.0">',
              file=fichero)
        print("</head>", file=fichero)
        print("", file=fichero)
        print("<body>", file=fichero)
        print('  <svg version="1.1" xmlns="http://www.w3.org/2000/svg"', file=fichero)
        print('    width="620" height="320" viewBox="-10 -10 620 320"', file=fichero)
        print('    style="border: black 1px solid">', file=fichero)
        for i in range(4):
            for j in range(11):
                print(f'    <circle cx="{30 * j}" cy="{30 * i}" r="5" fill="black" />',
                      file=fichero)
        print("  </svg>", file=fichero)
        print("</body>", file=fichero)
        print("</html>", file=fichero)

    webbrowser.open(ruta)


if __name__ == "__main__":
    main()

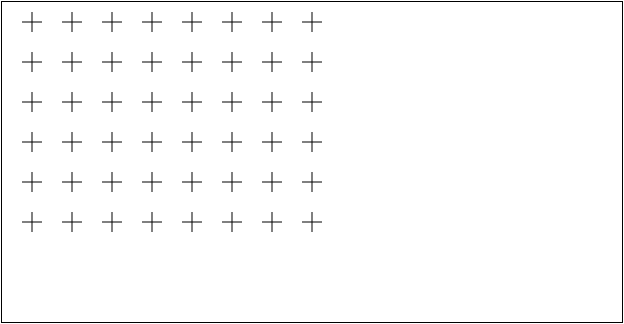
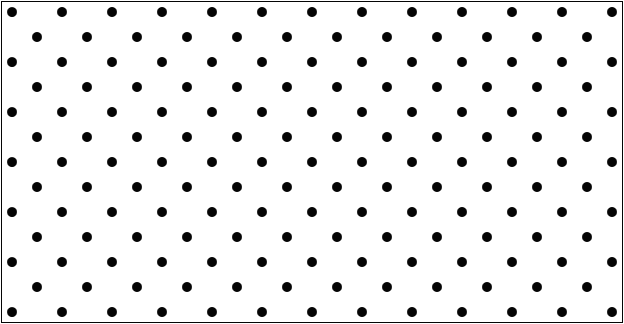
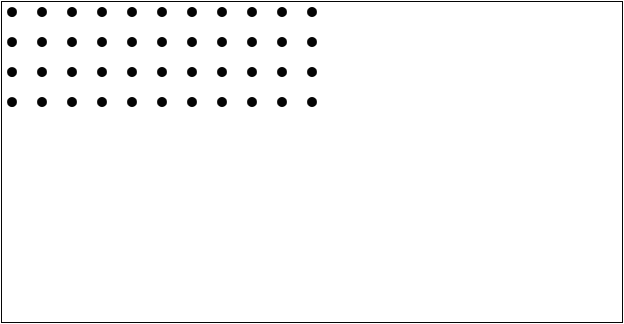
La imagen que queremos obtener se puede interpretar como cuatro filas formadas por once puntos.

SVG Ficheros (3) 1 1 a

Para generarla se pueden utilizar bucles anidados.

        for i in range(4):
            for j in range(11):
                ...

Ahora hay que relacionar los valores de i y j con las coordenadas de los puntos.

SVG Ficheros (3) 1 1 b

El bucle anidado podría ser:

        for i in range(4):
            for j in range(11):
                print(f'      <circle cx="{30 * j}" cy="{30 * i}" r="5" fill="black" />',
                      file=fichero)

Gráficos SVG Ficheros (3) - 1 - Figura 2

SVG Ficheros (3) 1 2
import webbrowser


def main():
    ruta = "svg-ficheros-3-1-2.html"

    with open(ruta, mode="w", encoding="utf-8") as fichero:
        print("<!DOCTYPE html>", file=fichero)
        print('<html lang="es">', file=fichero)
        print("<head>", file=fichero)
        print('  <meta charset="utf-8">', file=fichero)
        print("  <title>Ficheros (3) 1-2. SVG. Ejercicios. Python</title>", file=fichero)
        print('  <meta name="viewport" content="width=device-width, initial-scale=1.0">',
              file=fichero)
        print("</head>", file=fichero)
        print("", file=fichero)
        print("<body>", file=fichero)
        print('  <svg version="1.1" xmlns="http://www.w3.org/2000/svg"', file=fichero)
        print('    width="620" height="320" viewBox="-10 -10 620 320"', file=fichero)
        print('    style="border: black 1px solid">', file=fichero)
        for i in range(9):
            for j in range(6):
                print(f'    <circle cx="{60 * j}" cy="{30 * i}" r="5" fill="black" />',
                      file=fichero)
        print("  </svg>", file=fichero)
        print("</body>", file=fichero)
        print("</html>", file=fichero)

    webbrowser.open(ruta)


if __name__ == "__main__":
    main()

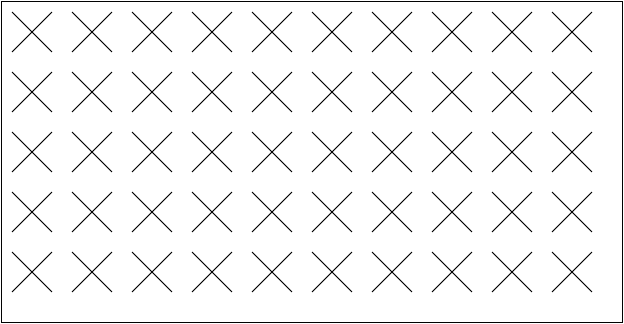
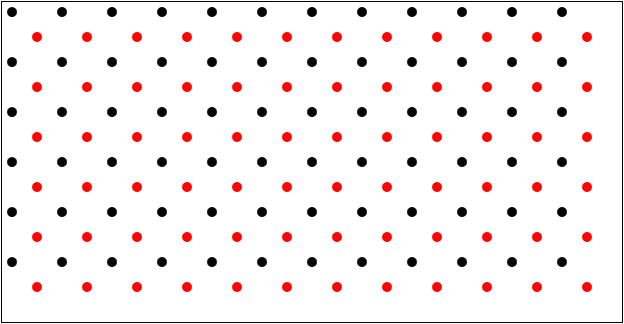
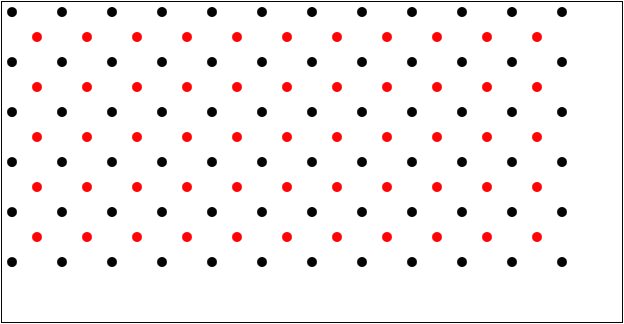
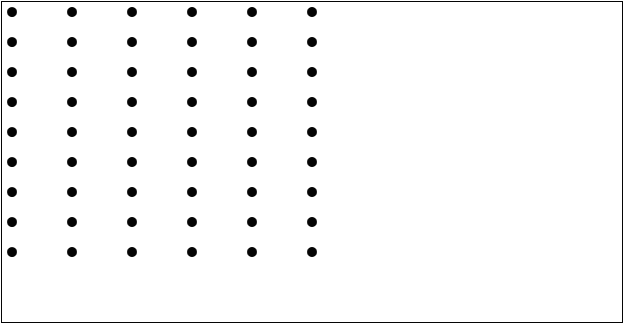
La imagen que queremos obtener se puede interpretar como nueve filas formadas por seis puntos.

SVG Ficheros (3) 1 2 a

Para generarla se pueden utilizar bucles anidados.

        for i in range(9):
            for j in range(6):
                ...

Ahora hay que relacionar los valores de i y j con las coordenadas de los puntos.

SVG Ficheros (3) 1 2 b

El bucle anidado podría ser:

        for i in range(9):
            for j in range(6):
                print(f'      <circle cx="{60 * j}" cy="{30 * i}" r="5" fill="black" />',
                      file=fichero)

Gráficos SVG Ficheros (3) - 1 - Figura 3

SVG Ficheros (3) 1 3
import webbrowser


def main():
    ruta = "svg-ficheros-3-1-3.html"

    with open(ruta, mode="w", encoding="utf-8") as fichero:
        print("<!DOCTYPE html>", file=fichero)
        print('<html lang="es">', file=fichero)
        print("<head>", file=fichero)
        print('  <meta charset="utf-8">', file=fichero)
        print("  <title>Ficheros (3) 1-3. SVG. Ejercicios. Python</title>", file=fichero)
        print('  <meta name="viewport" content="width=device-width, initial-scale=1.0">',
              file=fichero)
        print("</head>", file=fichero)
        print("", file=fichero)
        print("<body>", file=fichero)
        print('  <svg version="1.1" xmlns="http://www.w3.org/2000/svg"', file=fichero)
        print('    width="620" height="320" viewBox="-10 -10 620 320"', file=fichero)
        print('    style="border: black 1px solid">', file=fichero)
        for i in range(4):
            for j in range(8):
                print(f'    <circle cx="{60*j + 60}" cy="{60*i + 60}" r="60" '
                      'stroke="black" stroke-width="1" fill="none" />', file=fichero)
        print("  </svg>", file=fichero)
        print("</body>", file=fichero)
        print("</html>", file=fichero)

    webbrowser.open(ruta)


if __name__ == "__main__":
    main()

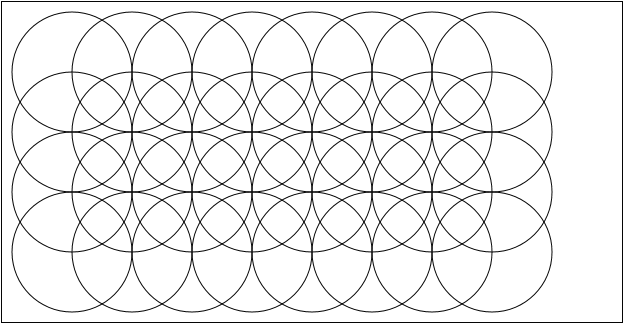
La imagen que queremos obtener se puede interpretar como cuatro filas formadas por ocho círculos. Para dibujar los círculos, lo importante es conocer los centros de los círculos, que se indican en la imagen siguiente.

SVG Ficheros (3) 1 3 a

Para generarla se pueden utilizar bucles anidados.

        for i in range(4):
            for j in range(8):
                ...

Ahora hay que relacionar los valores de i y j con las coordenadas de los puntos.

SVG Ficheros (3) 1 3 b

El bucle anidado podría ser:

        for i in range(4):
            for j in range(8):
                print(f'      <circle cx="{60*j + 60}" cy="{60*i + 60}" r="60" '
                      'stroke="black" stroke-width="1" fill="none" />', file=fichero)

Gráficos SVG Ficheros (3) - 1 - Figura 4

SVG Ficheros (3) 1 4
import webbrowser


def main():
    ruta = "svg-ficheros-3-1-4.html"

    with open(ruta, mode="w", encoding="utf-8") as fichero:
        print("<!DOCTYPE html>", file=fichero)
        print('<html lang="es">', file=fichero)
        print("<head>", file=fichero)
        print('  <meta charset="utf-8">', file=fichero)
        print("  <title>Ficheros (3) 1-4. SVG. Ejercicios. Python</title>", file=fichero)
        print('  <meta name="viewport" content="width=device-width, initial-scale=1.0">',
              file=fichero)
        print("</head>", file=fichero)
        print("", file=fichero)
        print("<body>", file=fichero)
        print('  <svg version="1.1" xmlns="http://www.w3.org/2000/svg"', file=fichero)
        print('    width="620" height="320" viewBox="-10 -10 620 320"', file=fichero)
        print('    style="border: black 1px solid">', file=fichero)
        for i in range(4):
            for j in range(12):
                print(f'    <rect x="{40 * j}" y="{40 * i}" width="20" height="20" '
                      'stroke="black" stroke-width="1" fill="none" />', file=fichero)
        print("  </svg>", file=fichero)
        print("</body>", file=fichero)
        print("</html>", file=fichero)

    webbrowser.open(ruta)


if __name__ == "__main__":
    main()

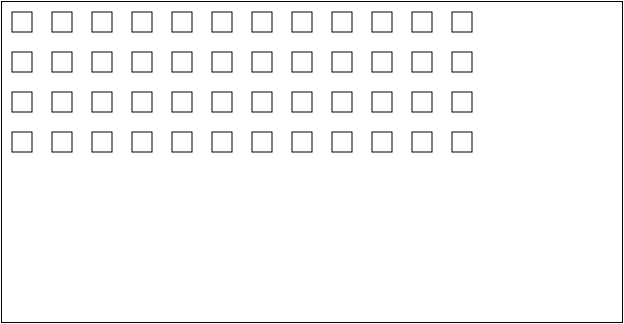
La imagen que queremos obtener se puede interpretar como cuatro filas formadas por doce cuadrados. Para dibujar los cuadrados, lo importante es conocer las esquinas superiores izquierda de los cuadrados, que se indican en la imagen siguiente.

SVG Ficheros (3) 1 4 a

Para generarla se pueden utilizar bucles anidados.

        for i in range(4):
            for j in range(12):
                ...

Ahora hay que relacionar los valores de i y j con las coordenadas de los puntos.

SVG Ficheros (3) 1 4 b

El bucle anidado podría ser:

        for i in range(4):
            for j in range(12):
                print(f'      <rect x="{40 * j}" y="{40 * i}" width="20" height="20" '
                      'stroke="black" stroke-width="1" fill="none" />', file=fichero)

Gráficos SVG Ficheros (3) - 1 - Figura 5

SVG Ficheros (3) 1 5
import webbrowser


def main():
    ruta = "svg-ficheros-3-1-5.html"

    with open(ruta, mode="w", encoding="utf-8") as fichero:
        print("<!DOCTYPE html>", file=fichero)
        print('<html lang="es">', file=fichero)
        print("<head>", file=fichero)
        print('  <meta charset="utf-8">', file=fichero)
        print("  <title>Ficheros (3) 1-5. SVG. Ejercicios. Python</title>", file=fichero)
        print('  <meta name="viewport" content="width=device-width, initial-scale=1.0">',
              file=fichero)
        print("</head>", file=fichero)
        print("", file=fichero)
        print("<body>", file=fichero)
        print('  <svg version="1.1" xmlns="http://www.w3.org/2000/svg"', file=fichero)
        print('    width="620" height="320" viewBox="-10 -10 620 320"', file=fichero)
        print('    style="border: black 1px solid">', file=fichero)
        for i in range(4):
            for j in range(20):
                print(f'    <rect x="{30 * j}" y="{80 * i}" width="20" height="20" '
                      'stroke="black" stroke-width="1" fill="none" />', file=fichero)
        print("  </svg>", file=fichero)
        print("</body>", file=fichero)
        print("</html>", file=fichero)

    webbrowser.open(ruta)


if __name__ == "__main__":
    main()

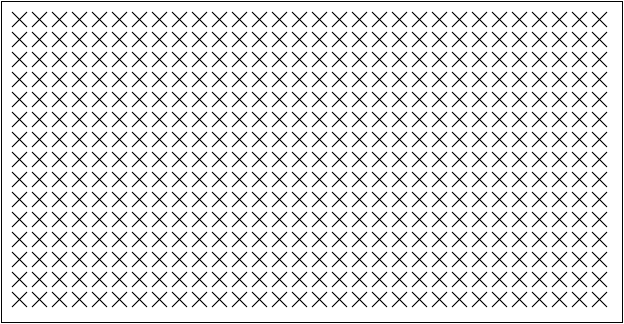
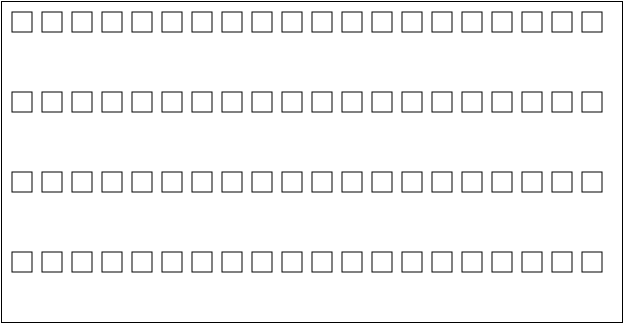
La imagen que queremos obtener se puede interpretar como cuatro filas formadas por veinte cuadrados. Para dibujar los cuadrados, lo importante es conocer las esquinas superiores izquierda de los cuadrados, que se indican en la imagen siguiente.

SVG Ficheros (3) 1 5 a

Para generarla se pueden utilizar bucles anidados.

        for i in range(4):
            for j in range(20):
                ...

Ahora hay que relacionar los valores de i y j con las coordenadas de los puntos.

SVG Ficheros (3) 1 5 b

El bucle anidado podría ser:

       for i in range(4):
            for j in range(20):
                print(f'      <rect x="{30 * j}" y="{80 * i}" width="20" height="20" '
                      'stroke="black" stroke-width="1" fill="none" />', file=fichero)

Gráficos SVG Ficheros (3) - 1 - Figura 6

SVG Ficheros (3) 1 6
import webbrowser


def main():
    ruta = "svg-ficheros-3-1-6.html"

    with open(ruta, mode="w", encoding="utf-8") as fichero:
        print("<!DOCTYPE html>", file=fichero)
        print('<html lang="es">', file=fichero)
        print("<head>", file=fichero)
        print('  <meta charset="utf-8">', file=fichero)
        print("  <title>Ficheros (3) 1-6. SVG. Ejercicios. Python</title>", file=fichero)
        print('  <meta name="viewport" content="width=device-width, initial-scale=1.0">',
              file=fichero)
        print("</head>", file=fichero)
        print("", file=fichero)
        print("<body>", file=fichero)
        print('  <svg version="1.1" xmlns="http://www.w3.org/2000/svg"', file=fichero)
        print('    width="620" height="320" viewBox="-10 -10 620 320"', file=fichero)
        print('    style="border: black 1px solid">', file=fichero)
        for i in range(6):
            for j in range(12):
                print(f'    <rect x="{50 * j}" y="{50 * i}" width="46" height="46" '
                      'stroke="black" stroke-width="1" fill="none" />', file=fichero)
        print("  </svg>", file=fichero)
        print("</body>", file=fichero)
        print("</html>", file=fichero)

    webbrowser.open(ruta)


if __name__ == "__main__":
    main()

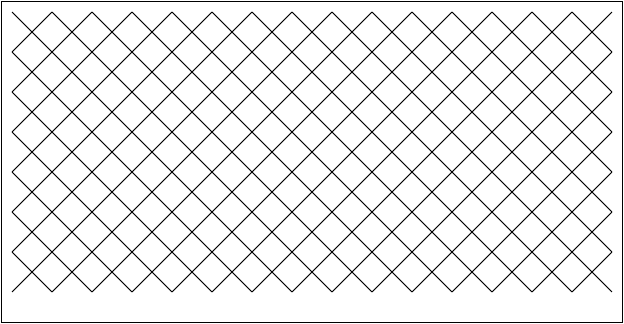
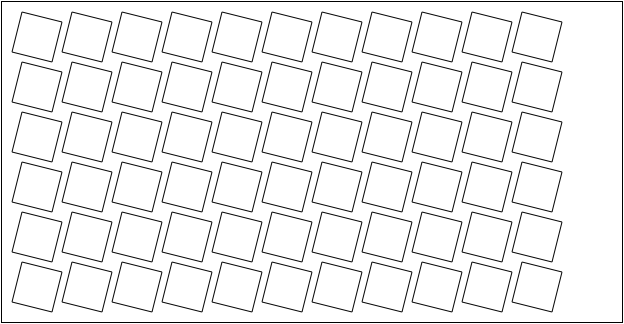
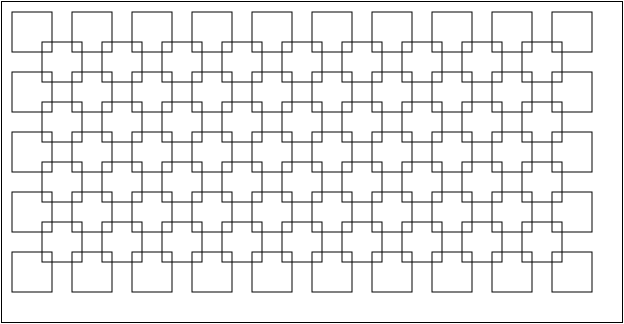
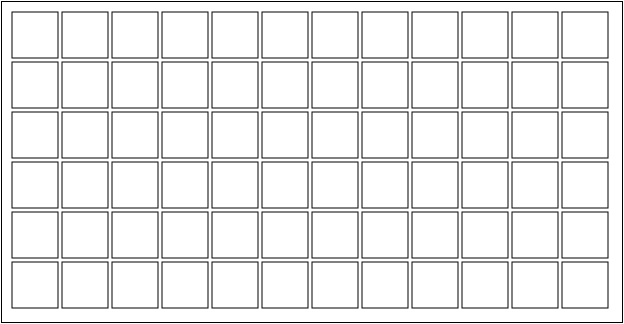
La imagen que queremos obtener se puede interpretar como seis filas formadas por doce cuadrados. Para dibujar los cuadrados, lo importante es conocer las esquinas superiores izquierda de los cuadrados, que se indican en la imagen siguiente.

SVG Ficheros (3) 1 6 a

Para generarla se pueden utilizar bucles anidados.

        for i in range(6):
            for j in range(12):
                ...

Ahora hay que relacionar los valores de i y j con las coordenadas de los puntos.

SVG Ficheros (3) 1 6 b

El bucle anidado podría ser:

        for i in range(6):
            for j in range(12):
                print(f'      <rect x="{50 * j}" y="{50 * i}" width="46" height="46" '
                      'stroke="black" stroke-width="1" fill="none" />', file=fichero)

Gráficos SVG Ficheros (3) - 2

Gráficos SVG Ficheros (3) - 2 - Figura 1

SVG Ficheros (3) 2 1
import webbrowser


def main():
    ruta = "svg-ficheros-3-2-1.html"

    with open(ruta, mode="w", encoding="utf-8") as fichero:
        print("<!DOCTYPE html>", file=fichero)
        print('<html lang="es">', file=fichero)
        print("<head>", file=fichero)
        print('  <meta charset="utf-8">', file=fichero)
        print("  <title>Ficheros (3) 2-1. SVG. Ejercicios. Python</title>", file=fichero)
        print('  <meta name="viewport" content="width=device-width, initial-scale=1.0">',
              file=fichero)
        print("</head>", file=fichero)
        print("", file=fichero)
        print("<body>", file=fichero)
        print('  <svg version="1.1" xmlns="http://www.w3.org/2000/svg"', file=fichero)
        print('    width="620" height="320" viewBox="-10 -10 620 320"', file=fichero)
        print('    style="border: black 1px solid">', file=fichero)
        for i in range(5):
            for j in range(10):
                print(f'    <line x1="{60 * j}" y1="{60 * i}" x2="{60*j + 40}" '
                      f'y2="{60*i + 40}" stroke="black" stroke-width="1" />',
                      file=fichero)
                print(f'    <line x1="{60*j + 40}" y1="{60 * i}" x2="{60 * j}" '
                      f'y2="{60*i + 40}" stroke="black" stroke-width="1" />',
                      file=fichero)
        print("  </svg>", file=fichero)
        print("</body>", file=fichero)
        print("</html>", file=fichero)

    webbrowser.open(ruta)


if __name__ == "__main__":
    main()

La imagen que queremos obtener se puede interpretar como cinco filas formadas por diez cruces.

SVG Ficheros (3) 2 1 a

Para generarla se pueden utilizar bucles anidados.

        for i in range(5):
            for j in range(10):
                ...

Para dibujar las cruces, habrá que dibujar dos segmentos en cada iteración. Para cada segmento, habrá que conocer sus vértices, que se indican en la imagen siguiente.

SVG Ficheros (3) 2 1 b

Ahora hay que relacionar los valores de i y j con las coordenadas de cada uno de los puntos.

SVG Ficheros (3) 2 1 c

Finalmente, el bucle anidado podría ser:

        for i in range(5):
            for j in range(10):
                print(f'      <line x1="{60 * j}" y1="{60 * i}" x2="{60*j + 40}" '
                      f'y2="{60*i + 40}" stroke="black" stroke-width="1" />',
                      file=fichero)
                print(f'      <line x1="{60*j + 40}" y1="{60 * i}" x2="{60 * j}" '
                      f'y2="{60*i + 40}" stroke="black" stroke-width="1" />',
                      file=fichero)

Cada uno de los parámetros del dibujo interviene en el bucle:

Gráficos SVG Ficheros (3) - 2 - Figura 2

SVG Ficheros (3) 2 2
import webbrowser


def main():
    ruta = "svg-ficheros-3-2-2.html"

    with open(ruta, mode="w", encoding="utf-8") as fichero:
        print("<!DOCTYPE html>", file=fichero)
        print('<html lang="es">', file=fichero)
        print("<head>", file=fichero)
        print('  <meta charset="utf-8">', file=fichero)
        print("  <title>Ficheros (3) 2-2. SVG. Ejercicios. Python</title>", file=fichero)
        print('  <meta name="viewport" content="width=device-width, initial-scale=1.0">',
              file=fichero)
        print("</head>", file=fichero)
        print("", file=fichero)
        print("<body>", file=fichero)
        print('  <svg version="1.1" xmlns="http://www.w3.org/2000/svg"', file=fichero)
        print('    width="620" height="320" viewBox="-10 -10 620 320"', file=fichero)
        print('    style="border: black 1px solid">', file=fichero)
        for i in range(15):
            for j in range(30):
                print(f'    <line x1="{20 * j}" y1="{20 * i}" x2="{20*j + 15}" '
                      f'y2="{20*i + 15}" stroke="black" stroke-width="1" />',
                      file=fichero)
                print(f'    <line x1="{20*j + 15}" y1="{20 * i}" x2="{20 * j}" '
                      f'y2="{20*i + 15}" stroke="black" stroke-width="1" />',
                      file=fichero)
        print("  </svg>", file=fichero)
        print("</body>", file=fichero)
        print("</html>", file=fichero)

    webbrowser.open(ruta)


if __name__ == "__main__":
    main()

Este ejercicio es muy similar al anterior. La diferencia con respecto al anterior es que las cruces son más pequeñas y hay más cruces.

Si el código del ejercicio anterior era:

        for i in range(5):
            for j in range(10):
                print(f'      <line x1="{60 * j}" y1="{60 * i}" x2="{60*j + 40}" '
                      f'y2="{60*i + 40}" stroke="black" stroke-width="1" />',
                      file=fichero)
                print(f'      <line x1="{60*j + 40}" y1="{60 * i}" x2="{60 * j}" '
                      f'y2="{60*i + 40}" stroke="black" stroke-width="1" />',
                      file=fichero)

Habría que cambiar:

Con lo que el bucle anidado quedaría:

        for i in range(15):
            for j in range(30):
                print(f'      <line x1="{20 * j}" y1="{20 * i}" x2="{20*j + 15}" '
                      f'y2="{20*i + 15}" stroke="black" stroke-width="1" />',
                      file=fichero)
                print(f'      <line x1="{20*j + 15}" y1="{20 * i}" x2="{20 * j}" '
                      f'y2="{20*i + 15}" stroke="black" stroke-width="1" />',
                      file=fichero)

Gráficos SVG Ficheros (3) - 2 - Figura 3

SVG Ficheros (3) 2 3
import webbrowser


def main():
    ruta = "svg-ficheros-3-2-3.html"

    with open(ruta, mode="w", encoding="utf-8") as fichero:
        print("<!DOCTYPE html>", file=fichero)
        print('<html lang="es">', file=fichero)
        print("<head>", file=fichero)
        print('  <meta charset="utf-8">', file=fichero)
        print("  <title>Ficheros (3) 2-3. SVG. Ejercicios. Python</title>", file=fichero)
        print('  <meta name="viewport" content="width=device-width, initial-scale=1.0">',
              file=fichero)
        print("</head>", file=fichero)
        print("", file=fichero)
        print("<body>", file=fichero)
        print('  <svg version="1.1" xmlns="http://www.w3.org/2000/svg"', file=fichero)
        print('    width="620" height="320" viewBox="-10 -10 620 320"', file=fichero)
        print('    style="border: black 1px solid">', file=fichero)
        for i in range(7):
            for j in range(15):
                print(f'    <line x1="{40 * j}" y1="{40 * i}" x2="{40*j + 40}" '
                      f'y2="{40*i + 40}" stroke="black" stroke-width="1" />',
                      file=fichero)
                print(f'    <line x1="{40*j + 40}" y1="{40 * i}" x2="{40 * j}" '
                      f'y2="{40*i + 40}" stroke="black" stroke-width="1" />',
                      file=fichero)
        print("  </svg>", file=fichero)
        print("</body>", file=fichero)
        print("</html>", file=fichero)

    webbrowser.open(ruta)


if __name__ == "__main__":
    main()

Este ejercicio vuelve a ser muy similar a los anteriores, aunque a primera vista pueda no parecerlo. La diferencia con respecto al anterior es que las cruces son más grandes y no hay espacio entre ellas.

SVG Ficheros (3) 2 3 a

Si el ancho del dibujo son 600 unidades y hay quince cruces por fila, cada cruz tiene un ancho de 40. Como las cruces son cuadradas, la altura de cada fila es también 40.

Si el código del primer ejercicio era:

        for i in range(5):
            for j in range(10):
                print(f'      <line x1="{60 * j}" y1="{60 * i}" x2="{60*j + 40}" '
                      f'y2="{60*i + 40}" stroke="black" stroke-width="1" />',
                      file=fichero)
                print(f'      <line x1="{60*j + 40}" y1="{60 * i}" x2="{60 * j}" '
                      f'y2="{60*i + 40}" stroke="black" stroke-width="1" />',
                      file=fichero)

Habría que cambiar:

Con lo que el bucle anidado quedaría:

        for i in range(7):
            for j in range(15):
                print(f'      <line x1="{40 * j}" y1="{40 * i}" x2="{40*j + 40}" '
                      f'y2="{40*i + 40}" stroke="black" stroke-width="1" />',
                      file=fichero)
                print(f'      <line x1="{40*j + 40}" y1="{40 * i}" x2="{40 * j}" '
                      f'y2="{40*i + 40}" stroke="black" stroke-width="1" />',
                      file=fichero)

Gráficos SVG Ficheros (3) - 2 - Figura 4

SVG Ficheros (3) 2 4
import webbrowser


def main():
    ruta = "svg-ficheros-3-2-4.html"

    with open(ruta, mode="w", encoding="utf-8") as fichero:
        print("<!DOCTYPE html>", file=fichero)
        print('<html lang="es">', file=fichero)
        print("<head>", file=fichero)
        print('  <meta charset="utf-8">', file=fichero)
        print("  <title>Ficheros (3) 2-4. SVG. Ejercicios. Python</title>", file=fichero)
        print('  <meta name="viewport" content="width=device-width, initial-scale=1.0">',
              file=fichero)
        print("</head>", file=fichero)
        print("", file=fichero)
        print("<body>", file=fichero)
        print('  <svg version="1.1" xmlns="http://www.w3.org/2000/svg"', file=fichero)
        print('    width="620" height="320" viewBox="-10 -10 620 320"', file=fichero)
        print('    style="border: black 1px solid">', file=fichero)
        for i in range(6):
            for j in range(8):
                print(f'    <line x1="{40*j + 20}" y1="{40 * i}" x2="{40*j + 20}" '
                      f'y2="{40*i + 20}" stroke="black" stroke-width="1" />',
                      file=fichero)
                print(f'    <line x1="{40*j + 10}" y1="{40*i + 10}" x2="{40*j + 30}" '
                      f'y2="{40*i + 10}" stroke="black" stroke-width="1" />',
                      file=fichero)
        print("  </svg>", file=fichero)
        print("</body>", file=fichero)
        print("</html>", file=fichero)

    webbrowser.open(ruta)


if __name__ == "__main__":
    main()

La imagen que queremos obtener se puede interpretar como seis filas formadas por ocho cruces.

SVG Ficheros (3) 2 4 a

Para generarla se pueden utilizar bucles anidados.

        for i in range(6):
            for j in range(8):
                ...

Para dibujar las cruces, habrá que dibujar dos segmentos en cada iteración. Para cada segmento, habrá que conocer sus vértices, que se indican en la imagen siguiente.

SVG Ficheros (3) 2 4 b

Ahora hay que relacionar los valores de i y j con las coordenadas de cada uno de los puntos.

Así, los valores de las coordenadas de los puntos serían:

SVG Ficheros (3) 2 4 c

Finalmente, el bucle anidado podría ser:

        for i in range(6):
            for j in range(8):
                print(f'      <line x1="{40*j + 20}" y1="{40 * i}" x2="{40*j + 20}" '
                      f'y2="{40*i + 20}" stroke="black" stroke-width="1" />',
                      file=fichero)
                print(f'      <line x1="{40*j + 10}" y1="{40*i + 10}" x2="{40*j + 30}" '
                      f'y2="{40*i + 10}" stroke="black" stroke-width="1" />',
                      file=fichero)

Gráficos SVG Ficheros (3) - 2 - Figura 5

SVG Ficheros (3) 2 5
import webbrowser


def main():
    ruta = "svg-ficheros-3-2-5.html"

    with open(ruta, mode="w", encoding="utf-8") as fichero:
        print("<!DOCTYPE html>", file=fichero)
        print('<html lang="es">', file=fichero)
        print("<head>", file=fichero)
        print('  <meta charset="utf-8">', file=fichero)
        print("  <title>Ficheros (3) 2-5. SVG. Ejercicios. Python</title>", file=fichero)
        print('  <meta name="viewport" content="width=device-width, initial-scale=1.0">',
              file=fichero)
        print("</head>", file=fichero)
        print("", file=fichero)
        print("<body>", file=fichero)
        print('  <svg version="1.1" xmlns="http://www.w3.org/2000/svg"', file=fichero)
        print('    width="620" height="320" viewBox="-10 -10 620 320"', file=fichero)
        print('    style="border: black 1px solid">', file=fichero)
        for i in range(6):
            for j in range(11):
                print(f'    <line x1="{50*j + 10}" y1="{50 * i}" x2="{50*j + 50}" '
                      f'y2="{50*i + 10}" stroke="black" stroke-width="1" />',
                      file=fichero)
                print(f'    <line x1="{50*j + 50}" y1="{50*i + 10}" x2="{50*j + 40}" '
                      f'y2="{50*i + 50}" stroke="black" stroke-width="1" />',
                      file=fichero)
                print(f'    <line x1="{50*j + 40}" y1="{50*i + 50}" x2="{50 * j}" '
                      f'y2="{50*i + 40}" stroke="black" stroke-width="1" />',
                      file=fichero)
                print(f'    <line x1="{50 * j}" y1="{50*i + 40}" x2="{50*j + 10}" '
                      f'y2="{50 * i}" stroke="black" stroke-width="1" />',
                      file=fichero)
        print("  </svg>", file=fichero)
        print("</body>", file=fichero)
        print("</html>", file=fichero)

    webbrowser.open(ruta)


if __name__ == "__main__":
    main()

Gráficos SVG Ficheros (3) - 2 - Figura 6

SVG Ficheros (3) 2 6
import webbrowser


def main():
    ruta = "svg-ficheros-3-2-6.html"

    with open(ruta, mode="w", encoding="utf-8") as fichero:
        print("<!DOCTYPE html>", file=fichero)
        print('<html lang="es">', file=fichero)
        print("<head>", file=fichero)
        print('  <meta charset="utf-8">', file=fichero)
        print("  <title>Ficheros (3) 2-6. SVG. Ejercicios. Python</title>", file=fichero)
        print('  <meta name="viewport" content="width=device-width, initial-scale=1.0">',
              file=fichero)
        print("</head>", file=fichero)
        print("", file=fichero)
        print("<body>", file=fichero)
        print('  <svg version="1.1" xmlns="http://www.w3.org/2000/svg"', file=fichero)
        print('    width="620" height="320" viewBox="-10 -10 620 320"', file=fichero)
        print('    style="border: black 1px solid">', file=fichero)
        for i in range(4):
            for j in range(9):
                print(f'    <line x1="{60*j + 30}" y1="{60 * i}" x2="{60*j + 30}" '
                      f'y2="{60*i + 15}" stroke="black" stroke-width="1" />',
                      file=fichero)
                print(f'    <line x1="{60*j + 30}" y1="{60*i + 45}" x2="{60*j + 30}" '
                      f'y2="{60*i + 60}" stroke="black" stroke-width="1" />',
                      file=fichero)
                print(f'    <line x1="{60 * j}" y1="{60*i + 30}" x2="{60*j + 15}" '
                      f'y2="{60*i + 30}" stroke="black" stroke-width="1" />',
                      file=fichero)
                print(f'    <line x1="{60*j + 45}" y1="{60*i + 30}" x2="{60*j + 60}" '
                      f'y2="{60*i + 30}" stroke="black" stroke-width="1" />',
                      file=fichero)
                print(f'    <line x1="{60*j + 30}" y1="{60*i + 15}" x2="{60*j + 45}" '
                      f'y2="{60*i + 30}" stroke="black" stroke-width="1" />',
                      file=fichero)
                print(f'    <line x1="{60*j + 45}" y1="{60*i + 30}" x2="{60*j + 30}" '
                      f'y2="{60*i + 45}" stroke="black" stroke-width="1" />',
                      file=fichero)
                print(f'    <line x1="{60*j + 30}" y1="{60*i + 45}" x2="{60*j + 15}" '
                      f'y2="{60*i + 30}" stroke="black" stroke-width="1" />',
                      file=fichero)
                print(f'    <line x1="{60*j + 15}" y1="{60*i + 30}" x2="{60*j + 30}" '
                      f'y2="{60*i + 15}" stroke="black" stroke-width="1" />',
                      file=fichero)
        print("  </svg>", file=fichero)
        print("</body>", file=fichero)
        print("</html>", file=fichero)

    webbrowser.open(ruta)


if __name__ == "__main__":
    main()

Gráficos SVG Ficheros (3) - 3

Gráficos SVG Ficheros (3) - 3 - Figura 1

SVG Ficheros (3) 3 1
import webbrowser


def main():
    ruta = "svg-ficheros-3-3-1.html"

    with open(ruta, mode="w", encoding="utf-8") as fichero:
        print("<!DOCTYPE html>", file=fichero)
        print('<html lang="es">', file=fichero)
        print("<head>", file=fichero)
        print('  <meta charset="utf-8">', file=fichero)
        print("  <title>Ficheros (3) 3-1. SVG. Ejercicios. Python</title>", file=fichero)
        print('  <meta name="viewport" content="width=device-width, initial-scale=1.0">',
              file=fichero)
        print("</head>", file=fichero)
        print("", file=fichero)
        print("<body>", file=fichero)
        print('  <svg version="1.1" xmlns="http://www.w3.org/2000/svg"', file=fichero)
        print('    width="620" height="320" viewBox="-10 -10 620 320"', file=fichero)
        print('    style="border: black 1px solid">', file=fichero)
        for i in range(6):
            for j in range(6):
                print(f'    <line x1="{120 * j}" y1="0" x2="{120 * i}" y2="300" '
                      'stroke="black" stroke-width="1" />', file=fichero)
        print("  </svg>", file=fichero)
        print("</body>", file=fichero)
        print("</html>", file=fichero)

    webbrowser.open(ruta)


if __name__ == "__main__":
    main()

Gráficos SVG Ficheros (3) - 3 - Figura 2

SVG Ficheros (3) 3 2
import webbrowser


def main():
    ruta = "svg-ficheros-3-3-2.html"

    with open(ruta, mode="w", encoding="utf-8") as fichero:
        print("<!DOCTYPE html>", file=fichero)
        print('<html lang="es">', file=fichero)
        print("<head>", file=fichero)
        print('  <meta charset="utf-8">', file=fichero)
        print("  <title>Ficheros (3) 3-2. SVG. Ejercicios. Python</title>", file=fichero)
        print('  <meta name="viewport" content="width=device-width, initial-scale=1.0">',
              file=fichero)
        print("</head>", file=fichero)
        print("", file=fichero)
        print("<body>", file=fichero)
        print('  <svg version="1.1" xmlns="http://www.w3.org/2000/svg"', file=fichero)
        print('    width="620" height="320" viewBox="-10 -10 620 320"', file=fichero)
        print('    style="border: black 1px solid">', file=fichero)
        for i in range(11):
            for j in range(11):
                print(f'    <line x1="{60 * j}" y1="0" x2="{60 * i}" y2="300" '
                      'stroke="black" stroke-width="1" />', file=fichero)
        print("  </svg>", file=fichero)
        print("</body>", file=fichero)
        print("</html>", file=fichero)

    webbrowser.open(ruta)


if __name__ == "__main__":
    main()

Gráficos SVG Ficheros (3) - 3 - Figura 3

SVG Ficheros (3) 3 3
import webbrowser


def main():
    ruta = "svg-ficheros-3-3-3.html"

    with open(ruta, mode="w", encoding="utf-8") as fichero:
        print("<!DOCTYPE html>", file=fichero)
        print('<html lang="es">', file=fichero)
        print("<head>", file=fichero)
        print('  <meta charset="utf-8">', file=fichero)
        print("  <title>Ficheros (3) 3-3. SVG. Ejercicios. Python</title>", file=fichero)
        print('  <meta name="viewport" content="width=device-width, initial-scale=1.0">',
              file=fichero)
        print("</head>", file=fichero)
        print("", file=fichero)
        print("<body>", file=fichero)
        print('  <svg version="1.1" xmlns="http://www.w3.org/2000/svg"', file=fichero)
        print('    width="620" height="320" viewBox="-10 -10 620 320"', file=fichero)
        print('    style="border: black 1px solid">', file=fichero)
        for i in range(6):
            for j in range(12):
                print(f'    <circle cx="{50 * j}" cy="{50 * i}" r="5" fill="black" />',
                      file=fichero)
                print(f'    <circle cx="{50*j + 25}" cy="{50*i + 25}" r="5" '
                      'fill="red" />', file=fichero)
        print("  </svg>", file=fichero)
        print("</body>", file=fichero)
        print("</html>", file=fichero)

    webbrowser.open(ruta)


if __name__ == "__main__":
    main()

Gráficos SVG Ficheros (3) - 3 - Figura 4

SVG Ficheros (3) 3 4
import webbrowser


def main():
    ruta = "svg-ficheros-3-3-4.html"

    with open(ruta, mode="w", encoding="utf-8") as fichero:
        print("<!DOCTYPE html>", file=fichero)
        print('<html lang="es">', file=fichero)
        print("<head>", file=fichero)
        print('  <meta charset="utf-8">', file=fichero)
        print("  <title>Ficheros (3) 3-4. SVG. Ejercicios. Python</title>", file=fichero)
        print('  <meta name="viewport" content="width=device-width, initial-scale=1.0">',
              file=fichero)
        print("</head>", file=fichero)
        print("", file=fichero)
        print("<body>", file=fichero)
        print('  <svg version="1.1" xmlns="http://www.w3.org/2000/svg"', file=fichero)
        print('    width="620" height="320" viewBox="-10 -10 620 320"', file=fichero)
        print('    style="border: black 1px solid">', file=fichero)
        for i in range(6):
            for j in range(12):
                print(f'    <circle cx="{50 * j}" cy="{50 * i}" r="5" fill="black" />',
                      file=fichero)
        for i in range(5):
            for j in range(11):
                print(f'    <circle cx="{50*j + 25}" cy="{50*i + 25}" r="5" '
                      'fill="red" />', file=fichero)
        print("  </svg>", file=fichero)
        print("</body>", file=fichero)
        print("</html>", file=fichero)

    webbrowser.open(ruta)


if __name__ == "__main__":
    main()

Gráficos SVG Ficheros (3) - 3 - Figura 5

SVG Ficheros (3) 3 5
import webbrowser


def main():
    ruta = "svg-ficheros-3-3-5.html"

    with open(ruta, mode="w", encoding="utf-8") as fichero:
        print("<!DOCTYPE html>", file=fichero)
        print('<html lang="es">', file=fichero)
        print("<head>", file=fichero)
        print('  <meta charset="utf-8">', file=fichero)
        print("  <title>Ficheros (3) 3-5. SVG. Ejercicios. Python</title>", file=fichero)
        print('  <meta name="viewport" content="width=device-width, initial-scale=1.0">',
              file=fichero)
        print("</head>", file=fichero)
        print("", file=fichero)
        print("<body>", file=fichero)
        print('  <svg version="1.1" xmlns="http://www.w3.org/2000/svg"', file=fichero)
        print('    width="620" height="320" viewBox="-10 -10 620 320"', file=fichero)
        print('    style="border: black 1px solid">', file=fichero)
        for i in range(7):
            for j in range(13):
                print(f'    <circle cx="{50 * j}" cy="{50 * i}" r="5" fill="black" />',
                      file=fichero)
        for i in range(6):
            for j in range(12):
                print(f'    <circle cx="{50*j + 25}" cy="{50*i + 25}" r="5" '
                      'fill="black" />', file=fichero)
        print("  </svg>", file=fichero)
        print("</body>", file=fichero)
        print("</html>", file=fichero)

    webbrowser.open(ruta)


if __name__ == "__main__":
    main()

Gráficos SVG Ficheros (3) - 3 - Figura 6

SVG Ficheros (3) 3 6
import webbrowser


def main():
    ruta = "svg-ficheros-3-3-6.html"

    with open(ruta, mode="w", encoding="utf-8") as fichero:
        print("<!DOCTYPE html>", file=fichero)
        print('<html lang="es">', file=fichero)
        print("<head>", file=fichero)
        print('  <meta charset="utf-8">', file=fichero)
        print("  <title>Ficheros (3) 3-6. SVG. Ejercicios. Python</title>", file=fichero)
        print('  <meta name="viewport" content="width=device-width, initial-scale=1.0">',
              file=fichero)
        print("</head>", file=fichero)
        print("", file=fichero)
        print("<body>", file=fichero)
        print('  <svg version="1.1" xmlns="http://www.w3.org/2000/svg"', file=fichero)
        print('    width="620" height="320" viewBox="-10 -10 620 320"', file=fichero)
        print('    style="border: black 1px solid">', file=fichero)
        for i in range(5):
            for j in range(10):
                print(f'    <rect x="{60 * j}" y="{60 * i}" width="40" '
                      'height="40" stroke="black" stroke-width="1" fill="none" />',
                      file=fichero)
        for i in range(4):
            for j in range(9):
                print(f'    <rect x="{60*j + 30}" y="{60*i + 30}" width="40" '
                      'height="40" stroke="black" stroke-width="1" fill="none" />',
                      file=fichero)
        print("  </svg>", file=fichero)
        print("</body>", file=fichero)
        print("</html>", file=fichero)

    webbrowser.open(ruta)


if __name__ == "__main__":
    main()